Key Dashboard Sections
-
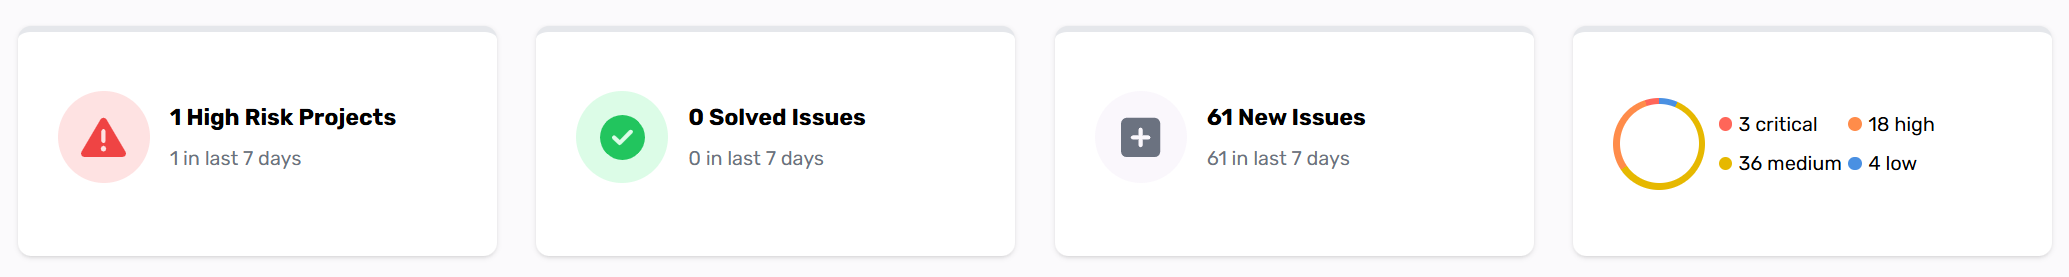
High-Risk Projects Count
Instantly see how many projects have critical or high-severity vulnerabilities. This allows teams to prioritize resources where they’re needed most. -
Recent Activity (7-Day Window)
- New Issues: The number of vulnerabilities discovered in the past week.
- Resolved Issues: How many vulnerabilities were fixed over the same period, reflecting your team’s remediation efforts.
-
Pie Chart: Vulnerabilities by Severity
A visual breakdown (Critical, High, Medium, Low) across your entire organization, offering a quick sense of overall risk distribution. -
Project List & Severity Counts
Below the summary stats, you’ll find a detailed table of all projects. Each row shows:- Project Name
- Open Vulnerabilities by Severity (e.g., 2 Critical, 5 High, 8 Medium)
- Scanner Type Counts (SAST, IAC, SCA) if you need to see which analysis is flagging the most issues.
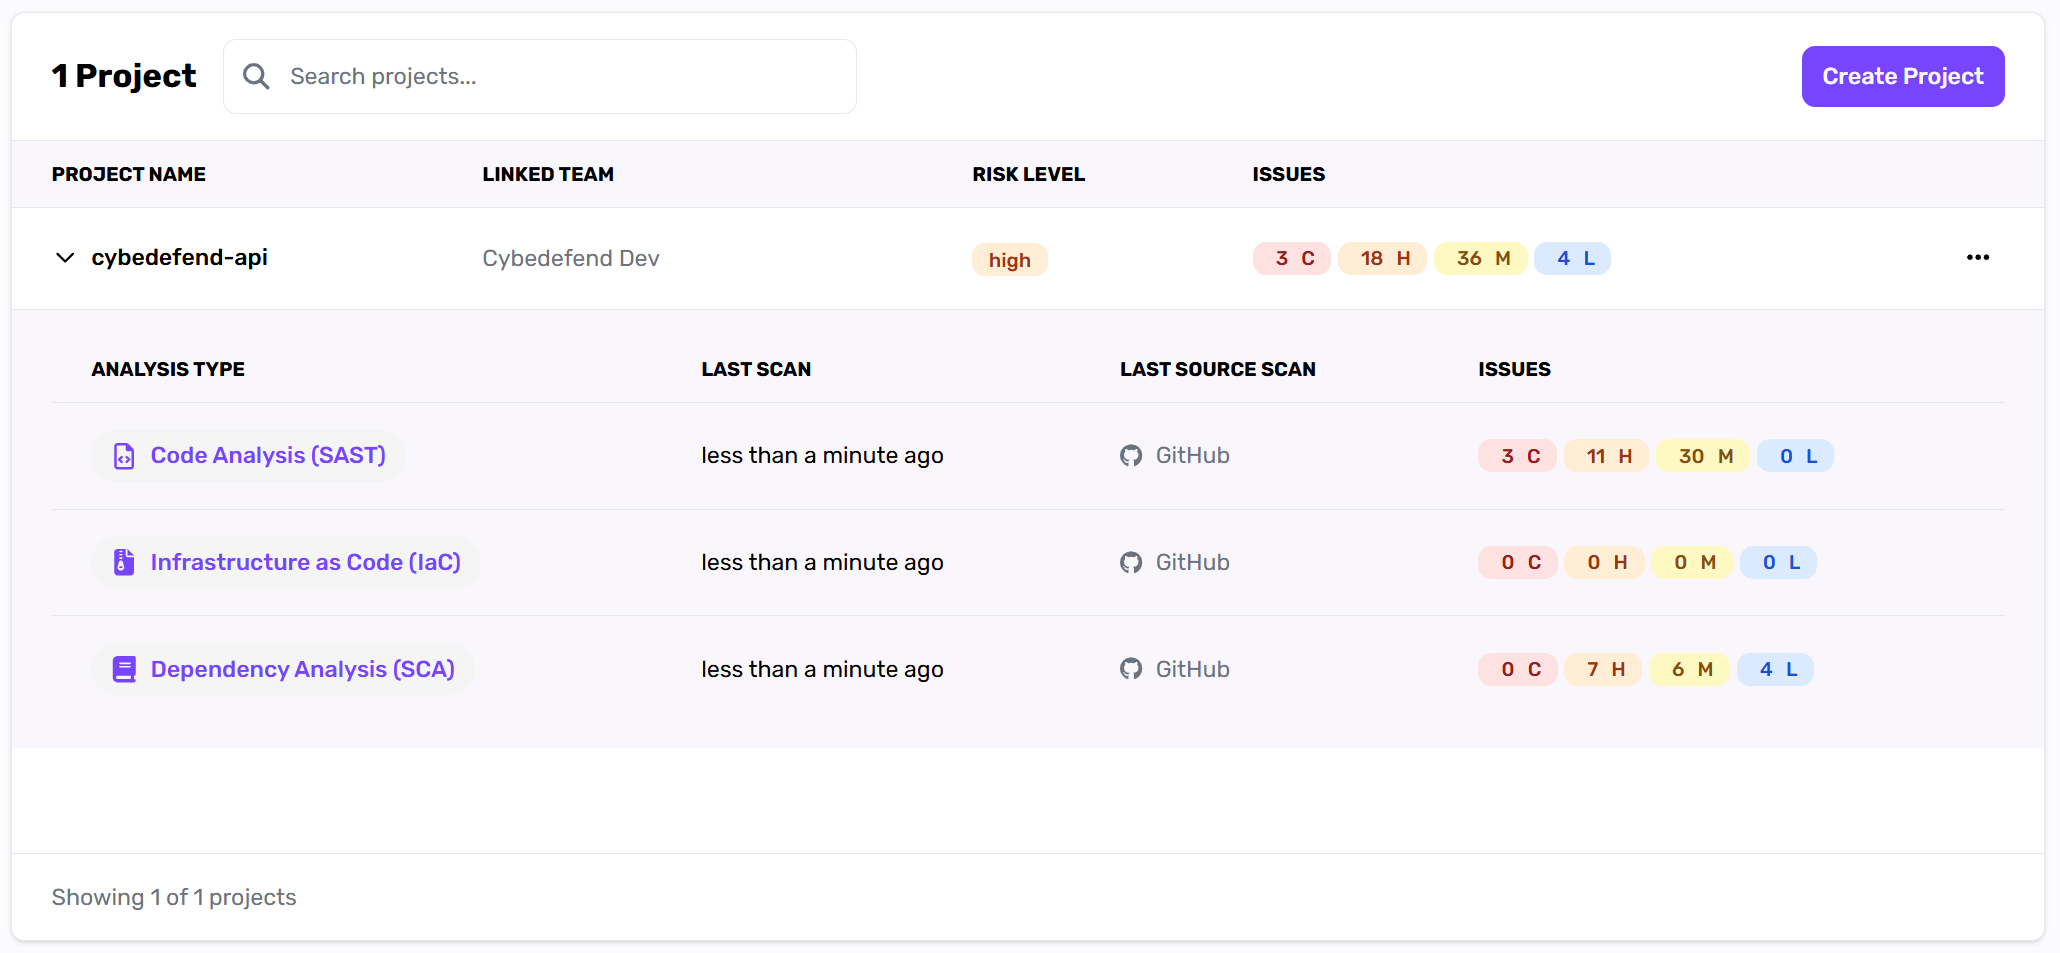
The table supports searching by project name. You can also click a project row to jump into its detailed vulnerability list.
(PS: of course our API is not vulnerable, it’s just an example :) )
Recommended Usage
- Daily Standups: Quickly identify if any new critical vulnerabilities appeared overnight.
- Reporting: Export or screenshot this page for management updates on your organization’s security trends.
- Prioritization: High-risk projects and spikes in new issues are immediate signals where additional focus may be needed.
Stay proactive by scheduling scans at a higher frequency for your “High-Risk Projects” to detect newly introduced vulnerabilities faster.